Skip to content

Excel

šŸ” Spreadsheets, Photos, and the Art of Moving Out

When you move out of a cohousing, you don’t just pack your boxes — you pack your shared life.
And in our case, that meant making an inventory of everything that lived in the house at Van Ooteghem:
Who takes what, what gets sold, and what’s destined for the containerpark.

To keep things organised (and avoid the classic ā€œwait, whose toaster was that again?ā€ discussion), we split the task — each person took care of one room.
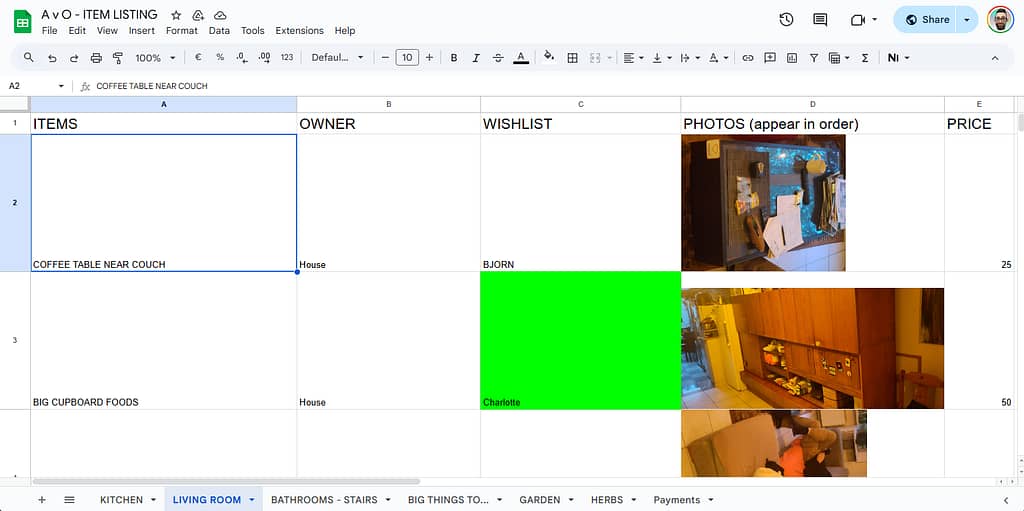
I was assigned to the living room.

I made photos of every item, uploaded them to our shared Dropbox folder, and listed them neatly in a Google spreadsheet:
one column for the Dropbox URL, another for the photo itself using the IMAGE() function, like this:

=IMAGE(A2)

šŸ“ø When Dropbox meets Google Sheets

Of course, it didn’t work immediately — because Dropbox links don’t point directly to the image.
They point to a webpage that shows a preview. Google Sheets looked at that and shrugged.

A typical Dropbox link looks like this:

https://www.dropbox.com/s/abcd1234efgh5678/photo.jpg?dl=0

So I used a small trick: in my IMAGE() formula, I replaced ?dl=0 with ?raw=1, forcing Dropbox to serve the actual image file.

=IMAGE(SUBSTITUTE(A2, "?dl=0", "?raw=1"))

And suddenly, there they were — tidy little thumbnails, each safely contained within its cell.


🧩 Making it fit just right

You can fine-tune how your image appears using the optional second argument of the IMAGE() function:

=IMAGE("https://example.com/image.jpg", mode)

Where:

  • 1 – fit to cell (default)
  • 2 – stretch (fill the entire cell, may distort)
  • 3 – keep original size
  • 4 – custom size, e.g. =IMAGE("https://example.com/image.jpg", 4, 50, 50) (sets width and height in pixels)

šŸ’” Resize the row or column if needed to make it look right.

That flexibility means you can keep your spreadsheet clean and consistent — even if your photos come in all sorts of shapes and sizes.


šŸ§ā€ā™€ļø The others tried it too…

My housemates loved the idea and started adding their own photos to the spreadsheet.
Except… they just pasted them in.
It looked great at first — until someone resized a row.
Then the layout turned into an abstract art project, with floating chairs and migrating coffee machines.

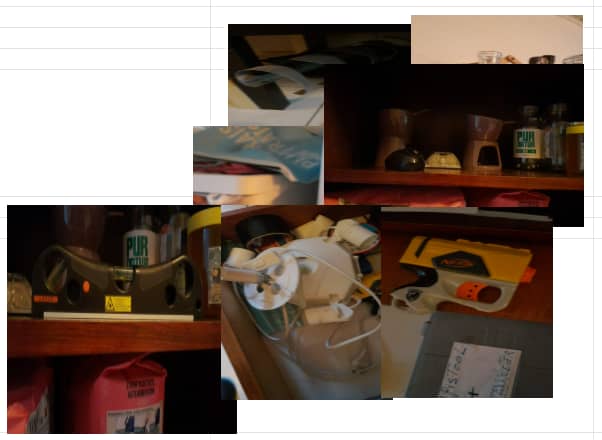
The moral of the story: IMAGE() behaves like cell content, while pasted images are wild creatures that roam free across your grid.


🧮 Bonus: The Excel version

If you’re more of an Excel person, there’s good news.
Recent versions of Excel 365 also support the IMAGE() function — almost identical to Google Sheets:

=IMAGE("https://www.dropbox.com/s/abcd1234efgh5678/photo.jpg?raw=1", "Fit")

If you’re still using an older version, you’ll need to insert pictures manually and set them to Move and size with cells.
Not quite as elegant, but it gets the job done.


🧹 Organised chaos, visual edition

So that’s how our farewell to Van Ooteghem turned into a tech experiment:
a spreadsheet full of URLs, formulas, furniture, and shared memories.

It’s oddly satisfying to scroll through — half practical inventory, half digital scrapbook.
Because even when you’re dismantling a home, there’s still beauty in a good system.

šŸ” How I Accidentally Discovered Power Query

A few weeks ago, I was knee-deep in CSV files. Not the fun kind. These were automatically generated reports from Cisco IronPort, and they weren’t exactly what I’d call analysis-friendly. Think: dozens of columns wide, thousands of rows, with summary data buried in awkward corners.

I was trying to make sense of incoming mail categories—Spam, Clean, Malware—and the numbers that went with them. Naturally, I opened the file in Excel, intending to wrangle the data manually like I usually do. You know: transpose the table, delete some columns, rename a few headers, calculate percentages… the usual grunt work.

But something was different this time. I noticed the ā€œGet & Transformā€ section in Excel’s Data ribbon. I had clicked it before, but this time I gave it a real shot. I selected ā€œFrom Text/CSVā€, and suddenly I was in a whole new environment: Power Query Editor.


🤯 Wait, What Is Power Query?

For those who haven’t met it yet, Power Query is a powerful tool in Excel (and also in Power BI) that lets you import, clean, transform, and reshape data before it even hits your spreadsheet. It uses a language called M, but you don’t really have to write code—although I quickly did, of course, because I can’t help myself.

In the editor, every transformation step is recorded. You can rename columns, remove rows, change data types, calculate new columns—all through a clean interface. And once you’re done, you just load the result into Excel. Even better: you can refresh it with one click when the source file updates.


🧪 From Curiosity to Control

Back to my IronPort report. I used Power Query to:

  • Transpose the data (turn columns into rows),
  • Remove columns I didn’t need,
  • Rename columns to something meaningful,
  • Convert text values to numbers,
  • Calculate the percentage of each message category relative to the total.

All without touching a single cell in Excel manually. What would have taken 15+ minutes and been error-prone became a repeatable, refreshable process. I even added a ā€œPercentā€ column that showed something like 53.4%—formatted just the way I wanted.


šŸ¤“ The Geeky Bit (Optional)

I quickly opened the Advanced Editor to look at the underlying M code. It was readable! With a bit of trial and error, I started customizing my steps, renaming variables for clarity, and turning a throwaway transformation into a well-documented process.

This was the moment it clicked: Power Query is not just a tool; it’s a pipeline.


šŸ’” Lessons Learned

  • Sometimes it pays to explore what’s already in the software you use every day.
  • Excel is much more powerful than most people realize.
  • Power Query turns tedious cleanup work into something maintainable and even elegant.
  • If you do something in Excel more than once, Power Query is probably the better way.

šŸŽÆ What’s Next?

I’m already thinking about integrating this into more of my work. Whether it’s cleaning exported logs, combining reports, or prepping data for dashboards, Power Query is now part of my toolkit.

If you’ve never used it, give it a try. You might accidentally discover your next favorite tool—just like I did.


Have you used Power Query before? Let me know your tips or war stories in the comments!

Quote of the day

This points, perhaps, to a network issue. (…) You might talk to your IT
person. The IT support is usually found in a remote janitor closet,
eating cheetos and drinking mountain dew while playing Everquest on a
wireless laptop. Just follow the crumbs.

— quaoar [at] tenthplanet.net in microsoft.public.excel.crashesgpfs

Soms kom je op de nieuwsgroepen de meest fantastische pareltjes tegen.
Ik was eigenlijk gewoon op zoek naar een oplossing voor een crash in Excel, maar dit antwoord stak er met kop en schouders bovenuit.
Niet dat het nuttig was — maar kom, ik heb wel luidop gelachen.

De beeldspraak is gewoon tĆ© mooi: ergens in een bezemkast, onder een stapel netwerkkabels, zit een IT’er te gamen, met oranje vingers van de cheetos, en een blikje Mountain Dew binnen handbereik. De draadloze verbinding hapert, maar hij merkt het niet, want hij is net een raid aan het leiden in Everquest.

Het doet me denken aan de stereotype LAN-party’s van vroeger. En toegegeven, ik herken mezelf er ook een beetje in. šŸ˜